Test Result Interpretation
On all laboratory reports you will see a variety of units and symbols. It is important to understand what these symbols are and what they mean for result interpretation. You may be required to convert your symbols and understanding what they are will make that process easier. The chart below are the common (but not all) units the SELS uses for reporting.

This table shows how test results are reported for water and soil samples.
For water, the amount of a substance is measured by volume. The common units are:
- milligrams per liter, also called parts per million,
- micrograms per liter, also called parts per billion.
For soil and sediment, the amount of a substance is measured by weight. The common units are:
- milligrams per kilogram, also called parts per million,
- micrograms per kilogram, also called parts per billion.
In short: water uses per liter units, and soil uses per kilogram units. Parts per million and parts per billion are just different ways of describing how much of something is present.
Units & Conversions
- ppm: Parts Per Million
- The number of parts of solute per 1 million parts of total solution. This can be applied to liquid and solid measurement.
- Also Known As: mg/L; mg/kg; μg/g
- In one Olympic size swimming pool, 1 ppm equals 1.25 liter bottles
- Example: 5 ppm of lead
- 5 grams of lead in 1 million grams of solution OR 5 milligrams of lead in 1 million milligram of solution OR 5 pounds of lead in 1 million pounds of solution
- ppb: Parts Per Billion
- The number of solute per 1 billion parts of total solution. This can be applied to liquid and solid measurement.
- Also Known As: μg/L; μg/kg
- In one Olympic size swimming pool, 1 ppb equals 0.5 teaspoon
- Example: 5 ppb of lead
- 5 grams of lead in 1 million grams of solution OR 5 milligrams of lead in 1 million milligram of solution OR 5 pounds of lead in 1 million pounds of solution
- μg/g: Microgram Per Gram
Also Known As: ppm
- mg/kg: Milligram Per Kilogram
Also Known As: ppm
- μg/kg: Microgram Per Kilogram
Also known As: ppb
- Helpful Conversions
- μg/g → mg/kg
- 1 μg/g = 1 mg/kg
- μg/g → mg/kg
- mg/L: Milligram Per Liter
Also known as: ppm
- μg/L: Microgram Per Liter
Also known as: ppb
- Helpful Conversions
- μg/L → mg/L
- n μg/L ÷ 1,000 = mg/L
- mg/L → μg/L
- n mg/L x 1,000 = μg/L
- μg/L → mg/L
- MPN: Most Probable Number
- Estimate of concentration of viable microorganisms in a sample by means of replicate liquid broth growth in ten-fold dilutions.
- Example: 50 MPN/100 mL
- 50 MPN/100 mL means that the Most Probable Number of viable cells in 100 mL of sample is 50
- Present or Absent
- The presence or absence of microorganisms
- Also known as: P/A OR +/-
- For public water supplies’ drinking water (water that has been chemically treated). By law, EPA states that the presence of any bacteria in drinking water must be treated (regardless of bacteria quantity).
- CFU: Colony Forming Units
- Number of viable bacterial cells in a sample per unit of volume
- Example: 50 CFU/100mL
- 50 CFU/100 mL means 50 Colony Forming Units per 100 mL of sample
- pCi: Picocuries
The curie is a standard measurement for the intensity of radioactivity contained in a sample. It’s not a measurement of volume or mass like in liquids or solids but the measurement of decay of radioactive atoms per minute. The basis for the curie is radioactivity of one gram of pure radium. Radium decays at a rate of apporxiametly 2.2 trillion disintegrations per minute. A picocurie is equal to the decay of two radioactive atoms per minute.- Example: 4 pCi/L
- 4 pCi/L means 8 atoms decaying every minute in every liter of water
- DPM: Disintegrations Per Minute
- The number of atoms that decay in one minute
- C: Celsius
- Measurement of temperature
- 0 °C is the freezing point of water
- 100 °C is the boiling point of water
- Helpful Conversion
- Celsius to Fahrenheit:
- (n °C x 1.8) + 32
- < : Less Than
- Denotes a value being smaller than the number in comparison.
- When this symbol appears on a SELS report, it means the value was less than the analytical reporting limit.
- J Qualifier
Indicates an estimated value
- MI Qualifier
Indicates a matrix interference and results could be biased high or low
- HT Qualifier
Indicates hold time was exceeded before sample receipt or sample analysis
- IP Qualifier
Indicates sample was improperly preserved
- BR Qualifier
Indicates sample was received broken
- LA Qualifier
Indicates a lab accident occurred and the sample can’t be analyzed
Unit Descriptions
Even though some units look different, they can actually be equivalent. This can get confusing when you begin comparing different laboratory reports or looking at EPA’s MCLs. Be prepared to convert and understand what units are equivalent.
Example: Result is 6 mg/l
6 mg/L = 6 ppm = 6,000 ppb = 6,000 μg/L

This chart shows that several different scientific units can represent the same concentration number.
One microgram per liter, written as one point zero micrograms per liter (1.0 µg/L).
One thousandth of a milligram per liter, written as zero point zero zero one milligrams per liter (0.001 mg/L).
One part per million, written as zero point zero zero one parts per million (0.001 ppm).
One part per billion, written as one point zero parts per billion (1.0 ppb).
The circle in the middle says “Same Number,” meaning that all four units are different ways of expressing the same concentration.
Unit Descriptions
- LIQUID
For concentrations of chemicals in water, they are measured in units of the mass of chemical (mg or µg) per volume of water (L). This is written as mg/L or µg/L. For example, your SEL results show 51.1 µg/L for Lead. This means for every 1 liter of water sample, there is 51.1 µg of Lead (or 0.0511 mg/L).
- SOLIDS
For concentrations of chemicals in soil samples, they are measured in units of the mass of chemical (mg or µg) per mass of soil (kg). This is written as mg/kg or µg/kg. For example, your SEL results show 51.1 µg/kg for Lead. This means for every 1 kilogram of soil sample, there is 51.1 µg of Lead (or 0.0511 mg/kg).
Test Results
Understanding your results is an easy three step process:
- Compare
- Convert (if applicable)
- Conclude
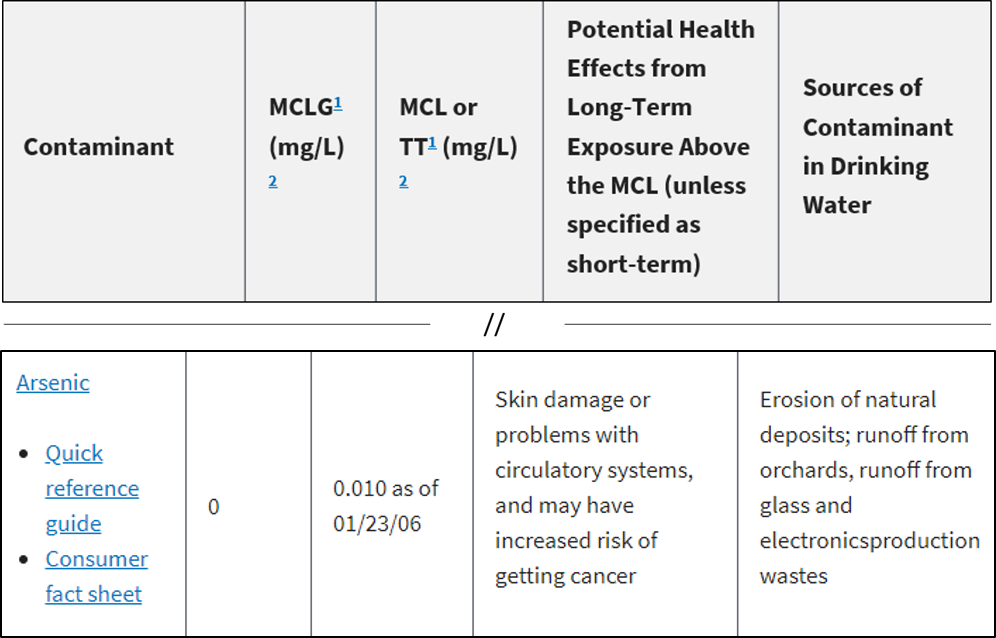
Once you have your results, compare your number to the EPA’s regulated Maximum Contaminant Levels (MCLs). For public water supplies, these are numbers that are legally enforceable standards that are applied to drinking water. For private citizens, the MCLs can serve as a great guideline for evaluating your results.
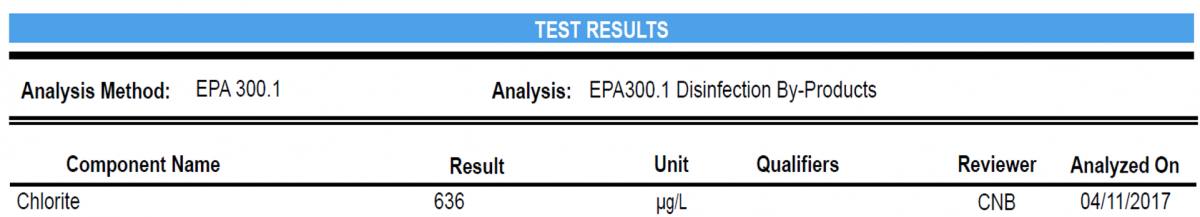
In this example, the “Component Name” is the analyte that you requested; Chlorite. Your result is 636 µg/L. Now, we look at the EPA’s MCLs and see that the Maximum Contaminant Level (MCL) amount of Chlorite that you can have in your result is 1.0 mg/L.
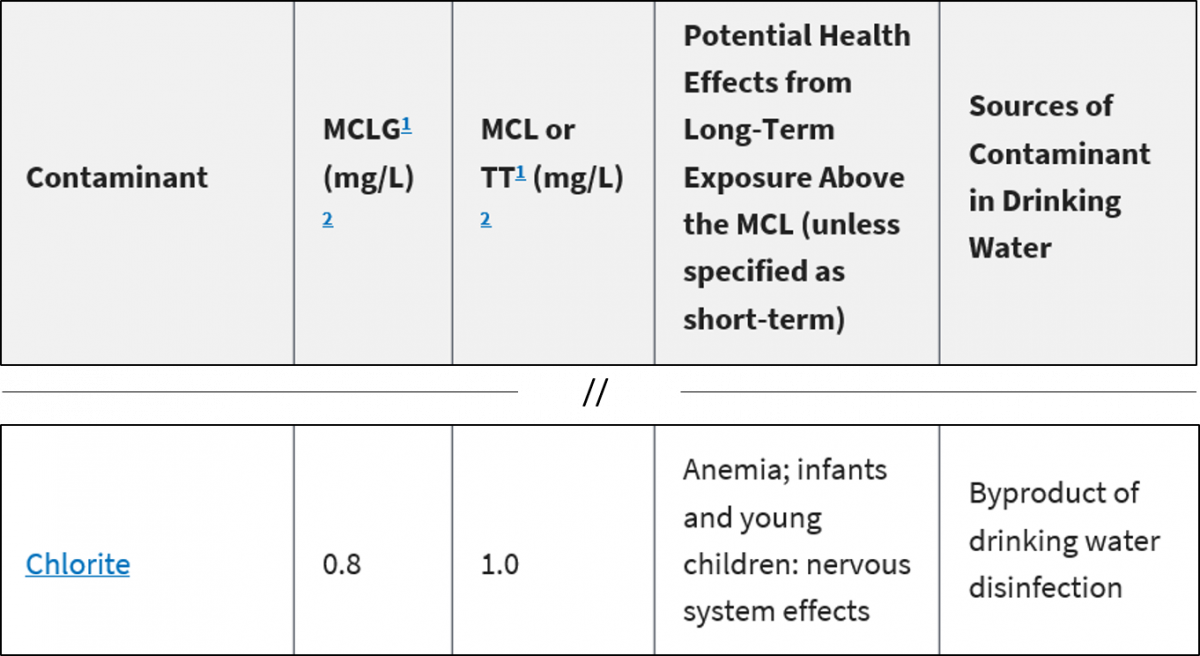
EPA’s MCL for Chlorite
CONVERT
When comparing the numbers, it may seem alarming to see such a large number; 636 µg/L. However you will notice that the EPA MCLs are reported in mg/L unlike SELS (SELS reported in µg/L). The next step to interpreting results is to ensure all the units from SELS and EPA are the same. This is especially import for Public Water Supplies needing to report for compliance. First convert your test result that was reported in µg/L to the same unit as EPA’s mg/L.
CONCLUDE
You have 0.636 mg/L of Chlorite per 1 Liter of water which is below the regulated 1.0 mg/L MCL established by EPA for public drinking water supplies.
COMPARE
Once you have your results, compare your number to the EPA’s regulated Maximum Contaminant Levels (MCLs). For public water supplies, these are numbers that are legally enforceable standards that are applied to drinking water. For private citizens, the MCLs can serve as a great guideline for evaluating your results.
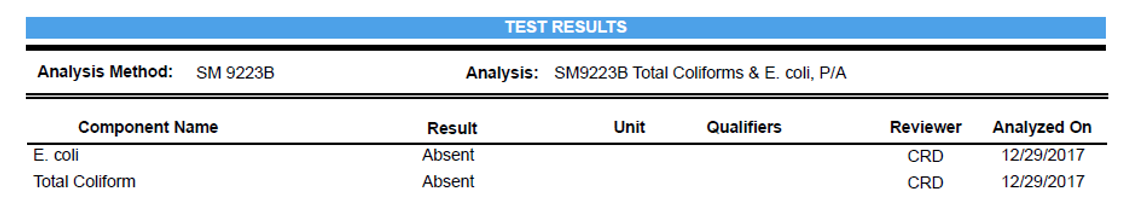
In this example, the “Component Name” is the analyte that you requested; E. Coli and Total Coliform. Your result for both analysis is Absent. Now, we look at the EPA’s MCLs and see that the Maximum Contaminant Level (MCL) amount of E. Coli and Total Coliform that you can have in your result is 5.0%. This 5.0% is in reference to the number of samples a Public Water Supply is required to collect during a compliance period (click here for Compliance Guidance). A private citizen should compare to the MCLG (Maximum Contaminant Level Goal); zero.
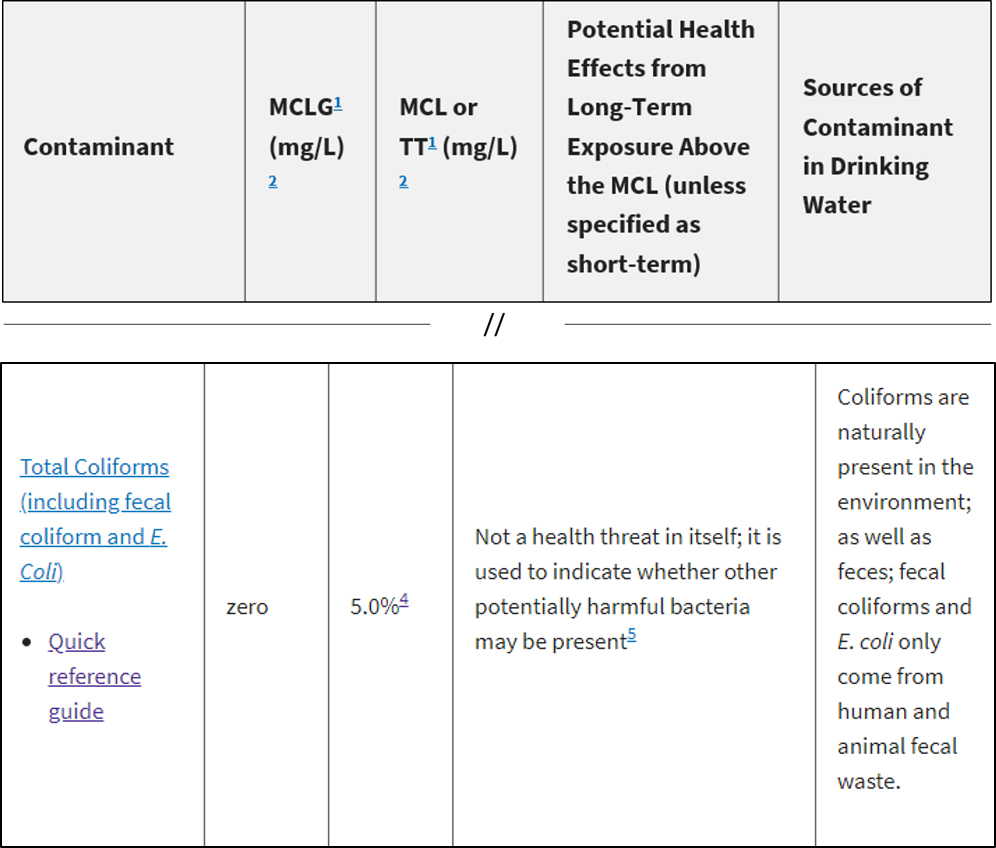
EPA’s MCL for Total Coliforms and E. Coli
CONVERT
When comparing these two results, Absent and zero, it easy to understand that they are equivalent.
CONCLUDE
Your water is Absent of E. Coli and Total Coliforms which is the same as EPA’s MCLG of zero.
COMPARE
Once you have your results, compare your number to the EPA’s regulated Maximum Contaminant Levels (MCLs). For public water supplies, these are numbers that are legally enforceable standards that are applied to drinking water. For private citizens, the MCLs can serve as a great guideline for evaluating your results.
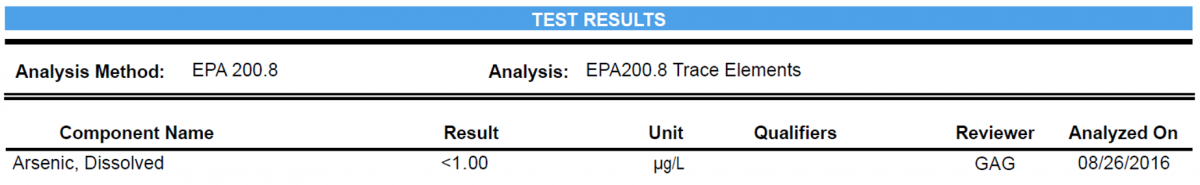
In this example, the “Component Name” is the analyte that you requested; Arsenic. Your result is <1.00 µg/L. Now, we look at the EPA’s MCLs and see that the Maximum Contaminant Level (MCL) amount of Arsenic that you can have in your result is 1.0 mg/L.
CONVERT
In this example, there is nothing to convert. When a report shows a result of <1.00, that means the actual value of the sample was less than the analytical reporting limit.
CONCLUDE
Your sample was less than the MCL of arsenic.
NEED A LITTLE MORE ASSISTANCE
Still unsure about your results? Give us a call at 405-702-1000 or email us at selsd@deq.ok.gov
Make sure you have your results on hand when contacting us. Below is the information you will need in order for us to better serve you.
- Sample Number (yellow): This is a unique ID that SELS gives to your specific sample
- Facility ID & Sampling Point (green): For Public Water Supplies only
- Component Name (red): This is what your sample was analyzed for
- Result (purple): What your analysis concluded
